median
don steward
mathematics teaching 10 ~ 16

Showing posts with label stem and leaf diagrams. Show all posts

Wednesday, 16 October 2019

stem and leaf diagram problems

this idea is from MathsPad, Nicola Waddilove and James Pearce

thanks to Jo Morgan for pointing it out

a ppt is here

[stem and leaf diagrams/display/plots/charts]

all of the digits, from 0 to 9, must be used (i.e. once only)


Saturday, 21 January 2012

comparing two data sets

the longevity of US Presidents has interesting features

a powerpoint is here

many students will sensibly think that more recent Presidents lived to an older age on average  due to advances in health care, nutrition and other factors that have led to a (general) increase in life expectancy

some Presidents in this data set are not counted (but could be)
this is to keep the sizes of the data sets the same (with apologies) for a frequency graph comparison

the data sets


a possible question to direct the study:


the analysis could use some of the following techniques
which are overlapping in terms of what they tell you:


little point in estimating the means - just to practise this technique


Monday, 29 August 2011

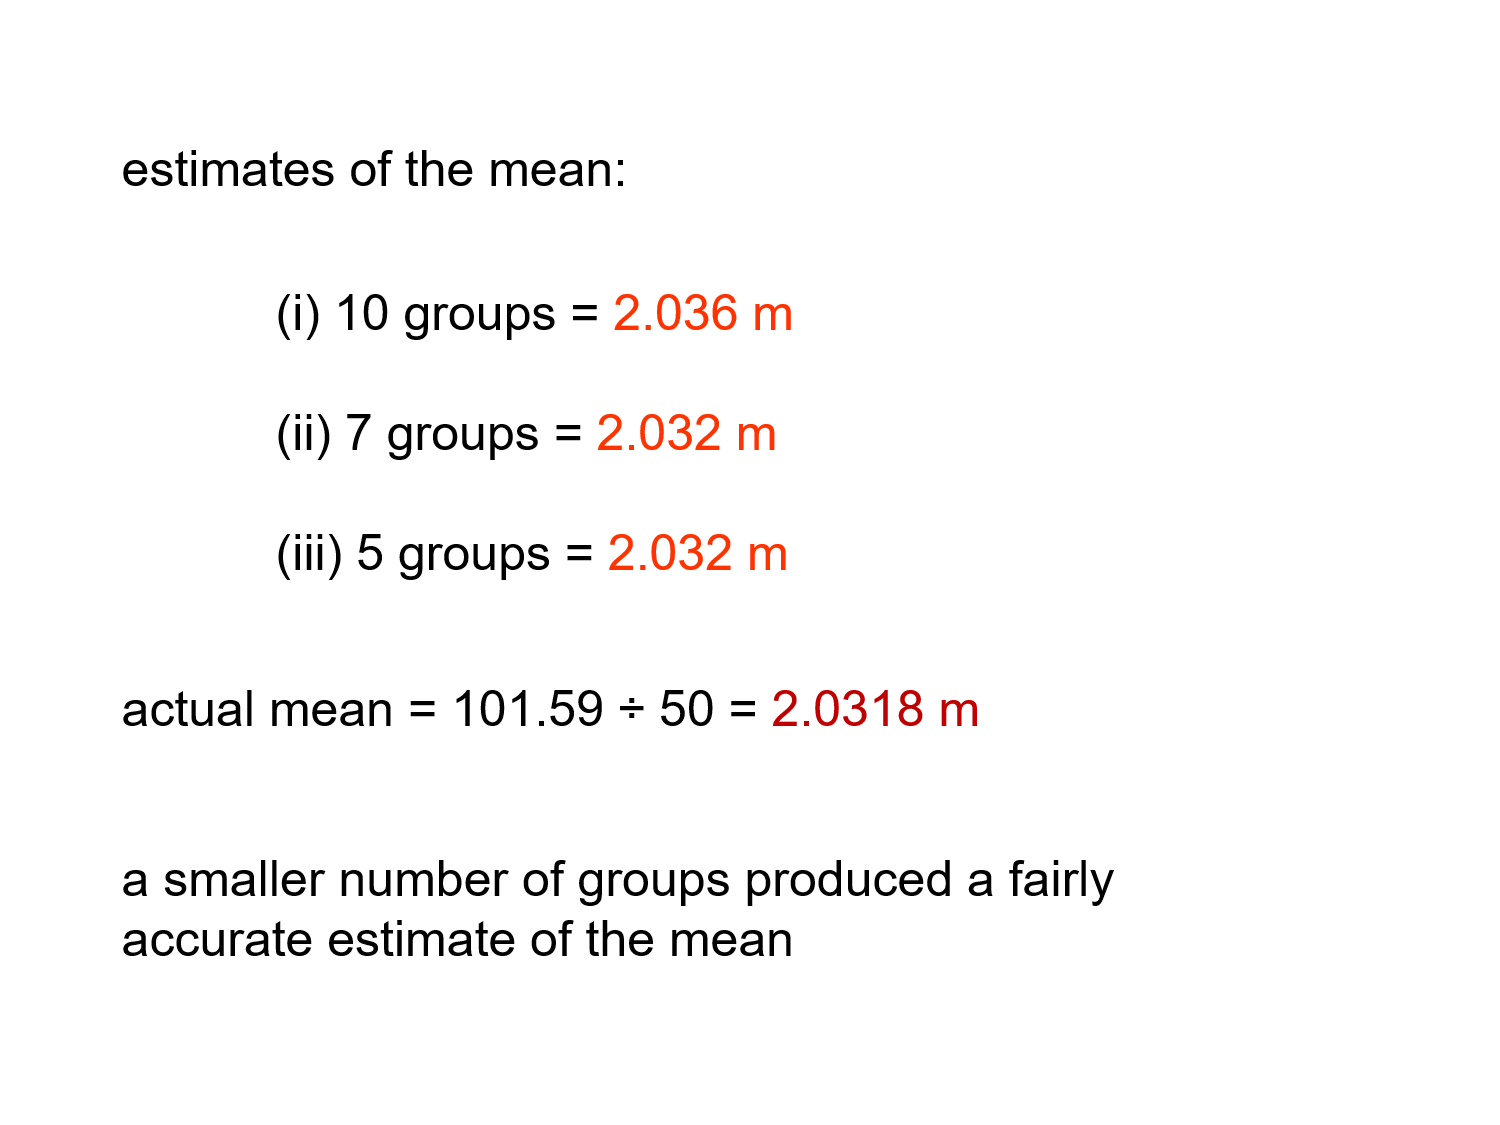
tomato plant heights

seeing how estimates of the mean vary for different numbers of groups

a ppt is here


helped by the data shape being normal?


Sunday, 3 April 2011

hold your breath

various statistical surveys suggest that children can hold their breath for up to and slightly beyond a minute

that makes it a good experiment for a classroom task on representing data

have a large clock (digital display preferably) available
ask students to take a deep breath, hold their nose and hold their breath for as long as they can
after one exhalation at the end, they note their time on a small wipe-board

at one school they get students to come out with their boards and get into groups according to the decade numbers (in seconds)

they then arrange themselves - so that an ordered stem and leaf plot is produced physically


as an alternative to breath holding, students could work in groups to see how long they can stand on one leg when they are blindfolded (or have their eyes shut - the 'blind stork' test)

again a minute is usually the most that people manage

they could compare standing on their right and left legs, possibly producing a scatter graph or a back-to-back stem and leaf diagram from the two data sets